Short demo on how to produce dynamic content in a shiny app at Rapporteket
makeSimpleHist(df, var, bins, makeTable = FALSE)Arguments
Value
a graphical object or data frame
Examples
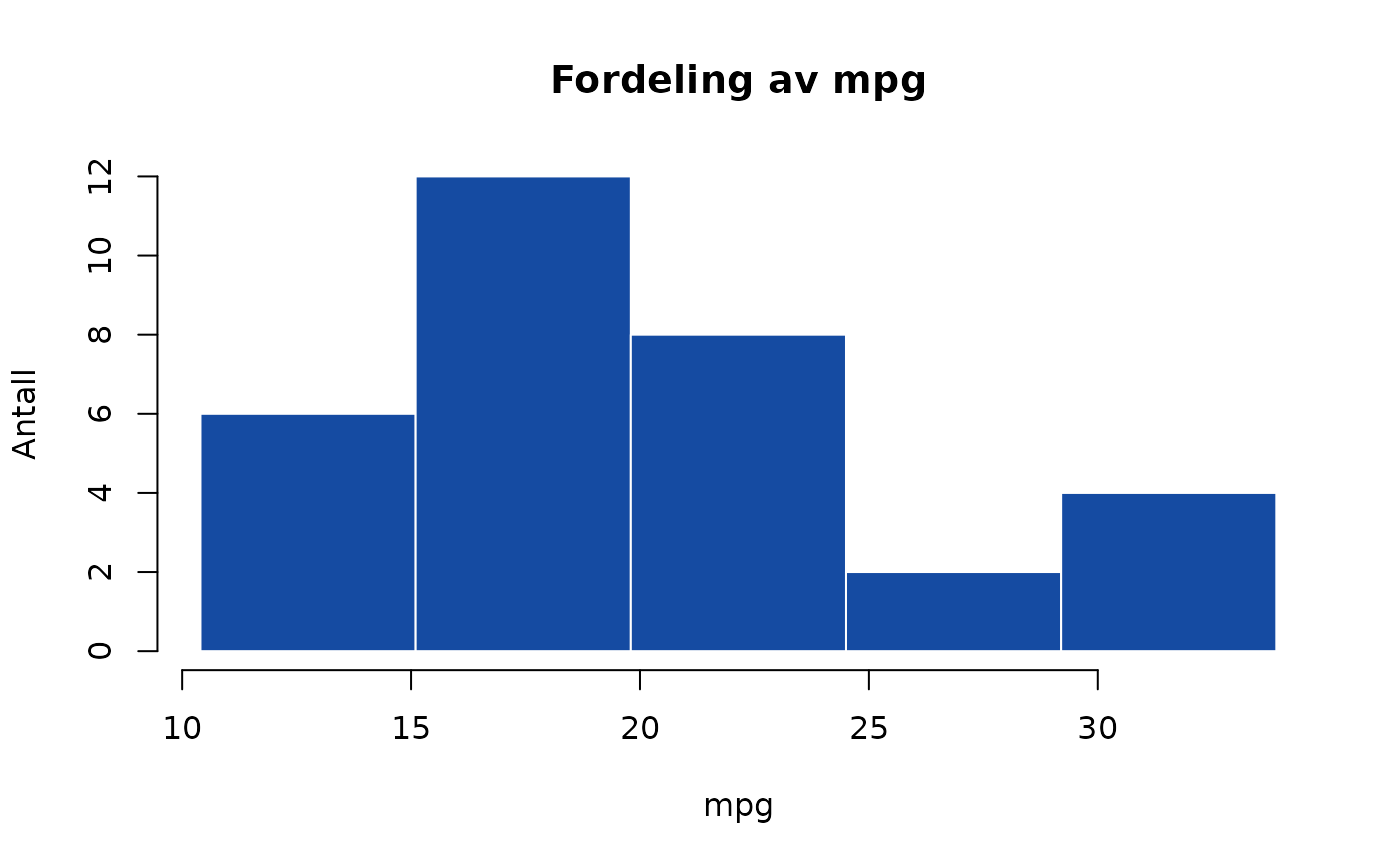
makeSimpleHist(df = mtcars, var = "mpg", bins = 5, makeTable = FALSE)

#> $breaks
#> [1] 10.4 15.1 19.8 24.5 29.2 33.9
#>
#> $counts
#> [1]  6 12  8  2  4
#>
#> $density
#> [1] 0.03989362 0.07978723 0.05319149 0.01329787 0.02659574
#>
#> $mids
#> [1] 12.75 17.45 22.15 26.85 31.55
#>
#> $xname
#> [1] "x"
#>
#> $equidist
#> [1] TRUE
#>
#> attr(,"class")
#> [1] "histogram"
#> $breaks
#> [1] 10.4 15.1 19.8 24.5 29.2 33.9
#>
#> $counts
#> [1] 6 12 8 2 4
#>
#> $density
#> [1] 0.03989362 0.07978723 0.05319149 0.01329787 0.02659574
#>
#> $mids
#> [1] 12.75 17.45 22.15 26.85 31.55
#>
#> $xname
#> [1] "x"
#>
#> $equidist
#> [1] TRUE
#>
#> attr(,"class")
#> [1] "histogram"